What the curve?
What the curve?


I’ve often thought about how in-depth and finite terms in sports and other pursuits can get. Even if you know a bit about them, witnessing a discussion between two people that know a lot more can make you feel like you’re listening to another language. For example, in tennis, there are rackets (or racquets, if you play a lot) and you play on courts. Easy enough. But in the scoring, zero is equal to “love” and points increase unevenly—15, 30, 40, and “game”... unless you are tied, then it’s “deuce.” And there are other terms like “lob,” “let,” and “approach.” But the definitions are pretty simple, so once you know what they mean, the language is unlocked.
The bond markets are similar—learn the terms and the language unlocks. Right now is a great time to learn bond terms because they are at the core of the current stock market debate.
In the last year, the yield curve has been inverted.
Let’s say that again with meaning: the yield curve, or the range of interest rates depending on the date they mature, of US treasury bonds (which are borrowings by the US government), has been inverted, where short term yields (aka rates), like the the 2-year, are higher than longer term yields, like the 10-year.
An inverted curve, as described above, has historically been taken as a sign that the bond market thinks the Fed will soon need to lower short-term interest rates to help stimulate growth during a coming recession—bringing the curve back to a “normal” position. So it’s kept many economists in the “bear” camp this year (among other reasons).
Let’s break this down in a chart (below). This chart reflects the yield curve in two different time periods—one month ago in blue and right now in red. It shows the interest rates, or yields, for each bond maturing in different time horizons. You can see the red and blue lines are both higher in the shorter time periods of 6 months to 2 years vs. the longer time periods of 10-30 years. This is the so-called inversion. The dark gray dotted line is hypothetical and reflects a “normal” non-inverted upward sloping curve—when the longer money is borrowed for, the higher the interest rate.
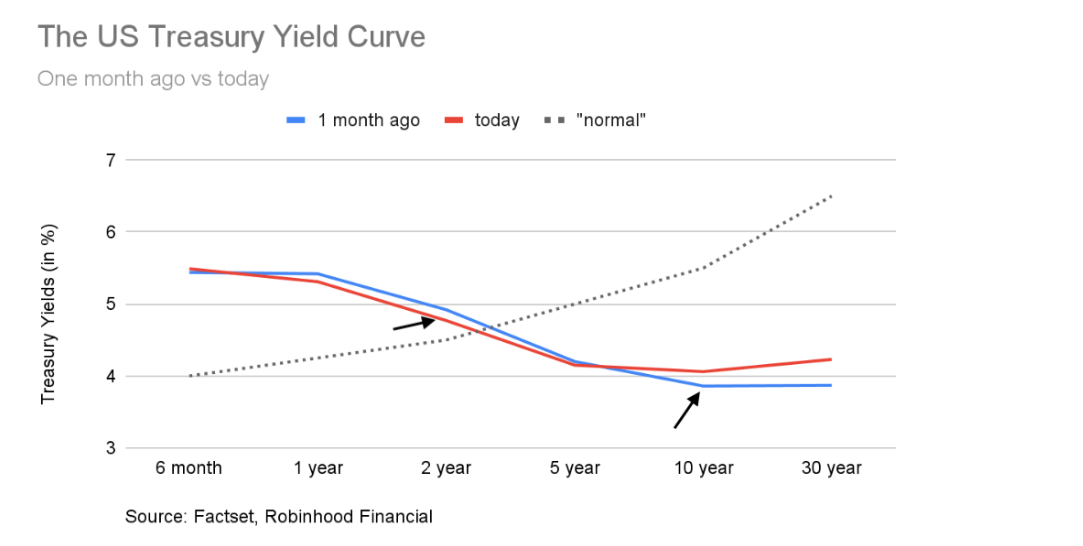
The arrows, by the two year and 10 year, point to how the yields have moved in the last month. The two year is lower by 0.15%, while the 10 year is higher by 0.20%—narrowing the spread (or difference between them) by 0.35%, steepening the yield curve.
Now one debate today is why this movement happened. Many want to stay in their bearish territory and say the steeper yield curve, towards “normal,” is due to things like higher US treasury issuance (because the US government needs to borrow more to spend more) and the recent Fitch downgrade (where a rating agency essentially lowered the credit score of the US government). They also state US stock valuations are expensive, especially with higher rates (see relationship description here).
Then they go further to state bonds are a better place to invest than stocks—something many have said all year—citing those expensive stock valuations but attractive bond yields. If you listened and invested in bonds at the start of the year, you would have had really small returns vs. stocks, so far.
Here’s what I think:
While bonds are historically more stable, the higher debt levels and lower credit score of the US government doesn't exactly point to more stable conditions for an investor. That seems contradictory to owning more vs. less.
Recent falling inflation has allowed the Fed to ease their tougher stance on short-term rates. I believe the steepening can be attributed to: 1) the unwinding of unconventional monetary policy we’ve seen these last 10 years or so and 2) better growth prospects.
But, the yield curve only moved toward “normal” in a meaningful way once lower inflation started to show up more consistently across different data points—in the last month. To me, that means it’s more because of better growth prospects. This also means despite higher rates, companies themselves should have better growth prospects.
A lot of this comes down to your own portfolios and tolerance for risk. Bonds tend to be lower risk, but also have limited upside. Within the right allocation, I’m not sure I would want to limit more of my upside in a better growth environment—especially if the intention of my investments is long term.
However, and like I’ve said in previous posts, the stock market has gotten a bit expensive, when you look at the different indices (like the S&P or Nasdaq). The top seven or eight largest stocks hold a high proportion of them, which have all had extraordinary runs so far this year. But once you go below those, such as in small caps or “value” sectors like financials, industrials, etc., there is still opportunity. So diversification is still and always important.
And I do still expect a short-term correction in September given these dynamics, plus that September is a historically poor month. So make sure you are diversified and if you have more cash to invest in stocks, you might be able to take your time over the next month.