High prices and high rates?
High prices and high rates?

Memories of 2008 still linger in my mind.
It was the beginning of what turned out to be a deep and wide recession, emanating from excesses in the housing market and loans from banks. You didn’t know where the bottom was — so working in markets, you took time minute by minute, hour by hour. You knew logically it would eventually be an opportunity, but fear was high. Because if you didn’t have a job, opportunities didn’t matter.
Nationally, home prices from bottom-to-peak in the cycle leading up to that (1991 to 2006) increased by 6% per year. For the next six years, they fell -4% per year. In this most recent housing cycle (2012 to 2022), the trough-to-peak increase in home values was 8% per year. I think because of this, many people might see housing as binary: Values are either rallying or collapsing. However, the reality is much more nuanced. Real estate, after all, is still local, properties differ as much as people, and people make all sorts of decisions (especially due to COVID).
For some context first, here’s a chart of national home prices in blue and 30-year mortgage rates in red, going back to 1987.
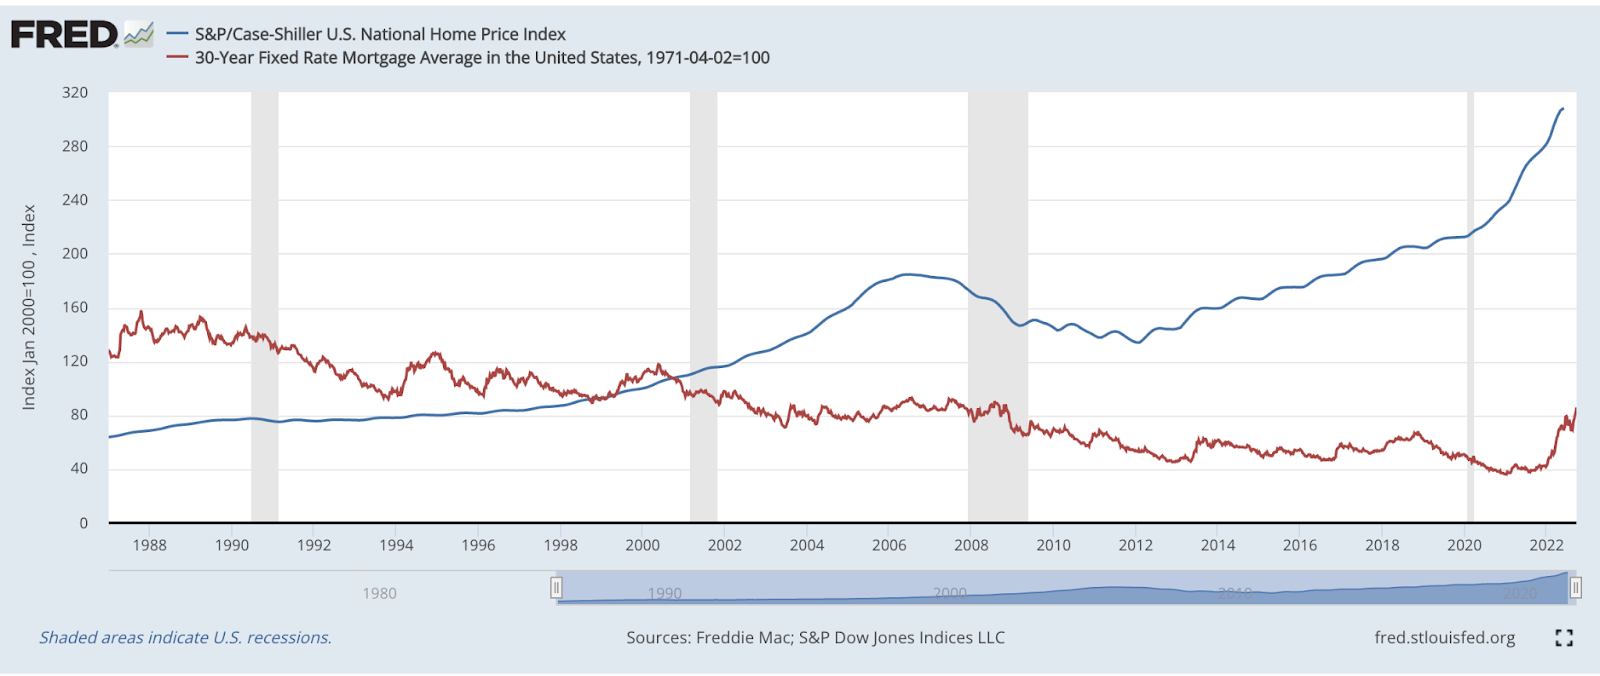
One main driver of property values is mortgage interest rates. Generally, the lower the rate, the less expensive it is to purchase the home — often leading to greater demand and higher values — and vice versa. Thirty-year mortgage rates fell -65% from 2000 to 2020, while home values rose. However, since the start of this year they are up about 100%... to levels not seen since 2008 (or 2001 depending on the specific metric). This has quickly made it much less affordable for the average family to buy a home. According to the National Association of Realtors, their Housing Affordability Index has dropped by 30% from December 2021 to July 2022. What that translates to in actual dollars — the monthly payment (P&I*) on a median priced single-family home jumped from $1,256 to $1,861 over this period. That’s meaningful. While underlying consumer fundamentals like employment and income remain relatively healthy, the median income increases have not offset the rising costs of borrowing to buy a house.
The other side of property values is supply — aka are more or fewer houses for sale now, and have the offer prices stayed the same?
Well, the National Association of Realtors data on supply of existing homes has increased from 2.6 months worth to 3.2 months worth year-over-year. With rising mortgage rates, falling affordability, and resulting higher supply, home prices have just started to fall. The S&P CoreLogic Case-Shiller 20-City Home Price Index was negative in the most recently reported month for the first time since 2012. Homebuilders have been reacting to lower prices as well. Residential construction and housing starts have both begun to roll over.
There are fewer buyers out there, due to affordability, or maybe also that many people made their purchases while rates were lower. In fact, underlying the latter point, the San Francisco Fed recently published an Economic Letter stating, “The shift to remote work may account for more than half of overall house price increases and similar increases in rents.” With this work-from-home transition fully established and more going back to the office now, this support should cool, if not go away.
Add in that personal savings rates have fallen to levels not seen since 2008, and I think housing prices will continue to fall. Though, if history is a guide, that can take time.
But real estate is local, so the story is different by region? Yes.
The trends discussed above are all there, but changes in affordability have differed quite a bit between regions. The aforementioned affordability index dropped the most in the South over the past year. And supply of homes for sale has differed by region as well. Florida has seen some of the biggest increases in the inventory of homes for sale. More generally, this makes sense to me. The places people were generally leaving (like NYC) may just plateau, while places that had a lot coming in, like Florida and other Southern states, may be due for more of a correction. Like I said, real estate is local.
Overall, it feels like the rise in rates, the fall in affordability, and the depletion of personal savings has to make a dent in home values, right?
*P&I = Principal and interest. The total payment from a mortgage includes paying back some of the total borrowed and interest each month.
Sources: S&P CoreLogic Case-Schiller US National Home Price NSA Index, Freddie Mac US Mortgage Market Survey 30 year Homeowner Commitment National Index, National Association of Realtors, US Bureau of Economic Analysis, Redfin, S&P Dow Jones Indices LLC, S&P/Case-Shiller U.S. National Home Price Index [CSUSHPINSA], retrieved from FRED, Federal Reserve Bank of St. Louis; https://fred.stlouisfed.org/series/CSUSHPINSA, September 27, 2022. Freddie Mac, 30-Year Fixed Rate Mortgage Average in the United States [MORTGAGE30US], retrieved from FRED, Federal Reserve Bank of St. Louis; https://fred.stlouisfed.org/series/MORTGAGE30US, September 27, 2022.