Lower inflation is good, right?
Lower inflation is good, right?


In many ways, yes. Our money goes farther when inflation is lower. It should also lead to better economic growth over time, versus a world where inflation is higher.
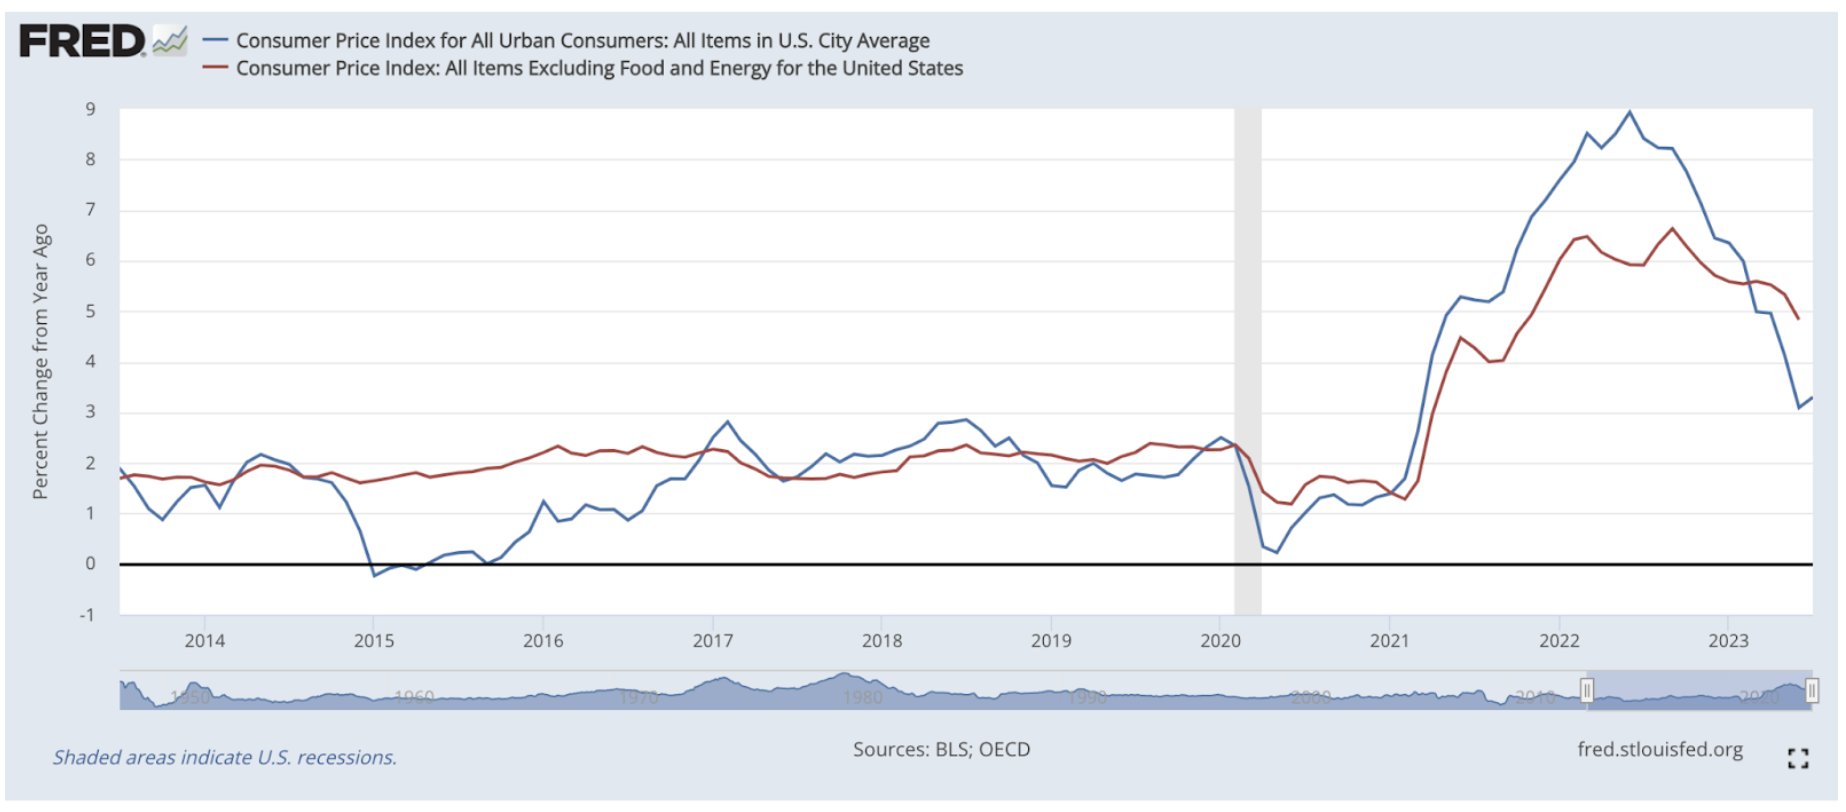
So far, things are heading that way. Below is a chart for both the “headline” and “core” Consumer Price Indices, and they have recently been falling:
But there is a place where this drop may be not-so-good. For certain companies, like consumer businesses and industrial companies that make or keep inventory to sell, rising prices tend to provide a benefit. This is because if inflation rises, the value of their inventory tends to also rise. The prices they sell this inventory at can increase, and in turn, grow their reported earnings. Thus, falling prices could have the opposite effect, potentially contracting profits.
This is particularly true if they use a “first in first out” (FIFO) inventory accounting method. In this method, the companies assume what they sell goes in order from the oldest to most recent. If prices of most things are going up, that means the least expensive items (aka the oldest when costs were lower) are sold against rising sale prices, naturally increasing profits.
While there are other methods as well (such as “last in first out” [LIFO], weighted average cost, and specific identification), based on data from Credit Suisse in 2021, more than half of the S&P 500 companies use FIFO.
Why is this relevant today? Because, as shown above, inflation has been falling, and we expect that to continue for goods. It’s possible earnings are negatively affected by this, leading to lower corporate profits than expected over the next year. In the short term, companies can’t easily adjust their inventories and operations to cut costs. Eventually, they do and manage inventory in a way that profits can rebound. But I believe we are not there yet.
In this chart, you can see what happened in the late 1970’s to early 1980’s period, when inflation, the green line, was also high. The blue line represents US corporate profits without any adjustments for inventory accounting, while the red line represents US corporate profits after adjusting for inventory accounting.
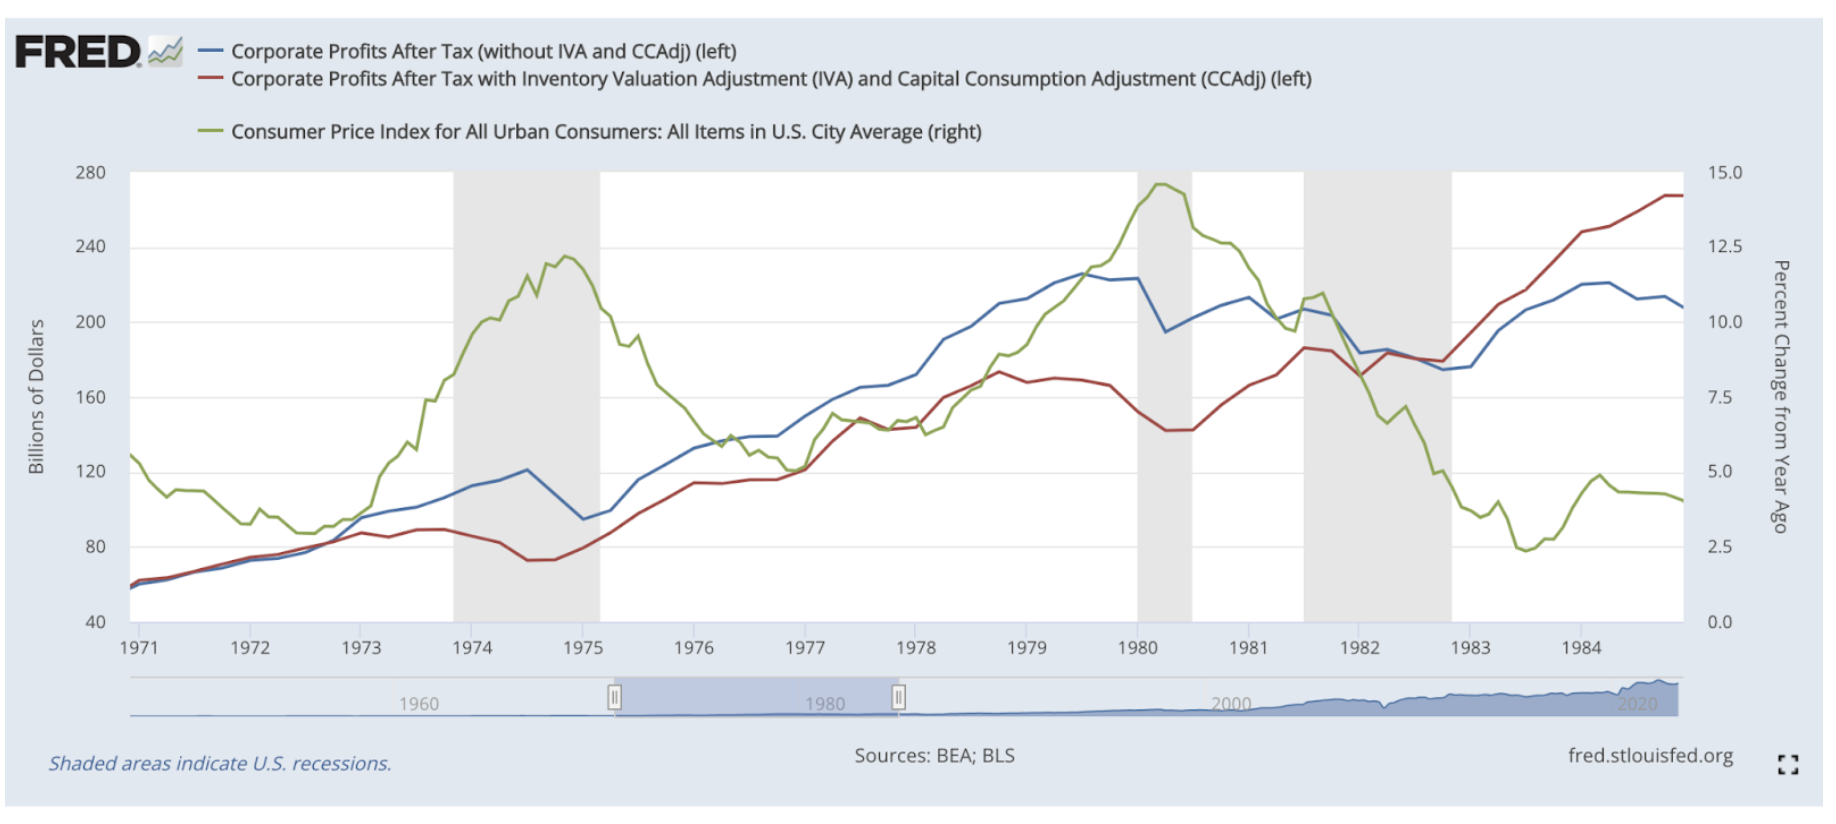
You can see during the periods where the green line is higher, the blue line, which is unadjusted corporate profits, is higher than the red line (adjusted). But, once inflation starts to come down meaningfully, around 1982, the red and blue lines cross, after a period of limited growth (and a recession).
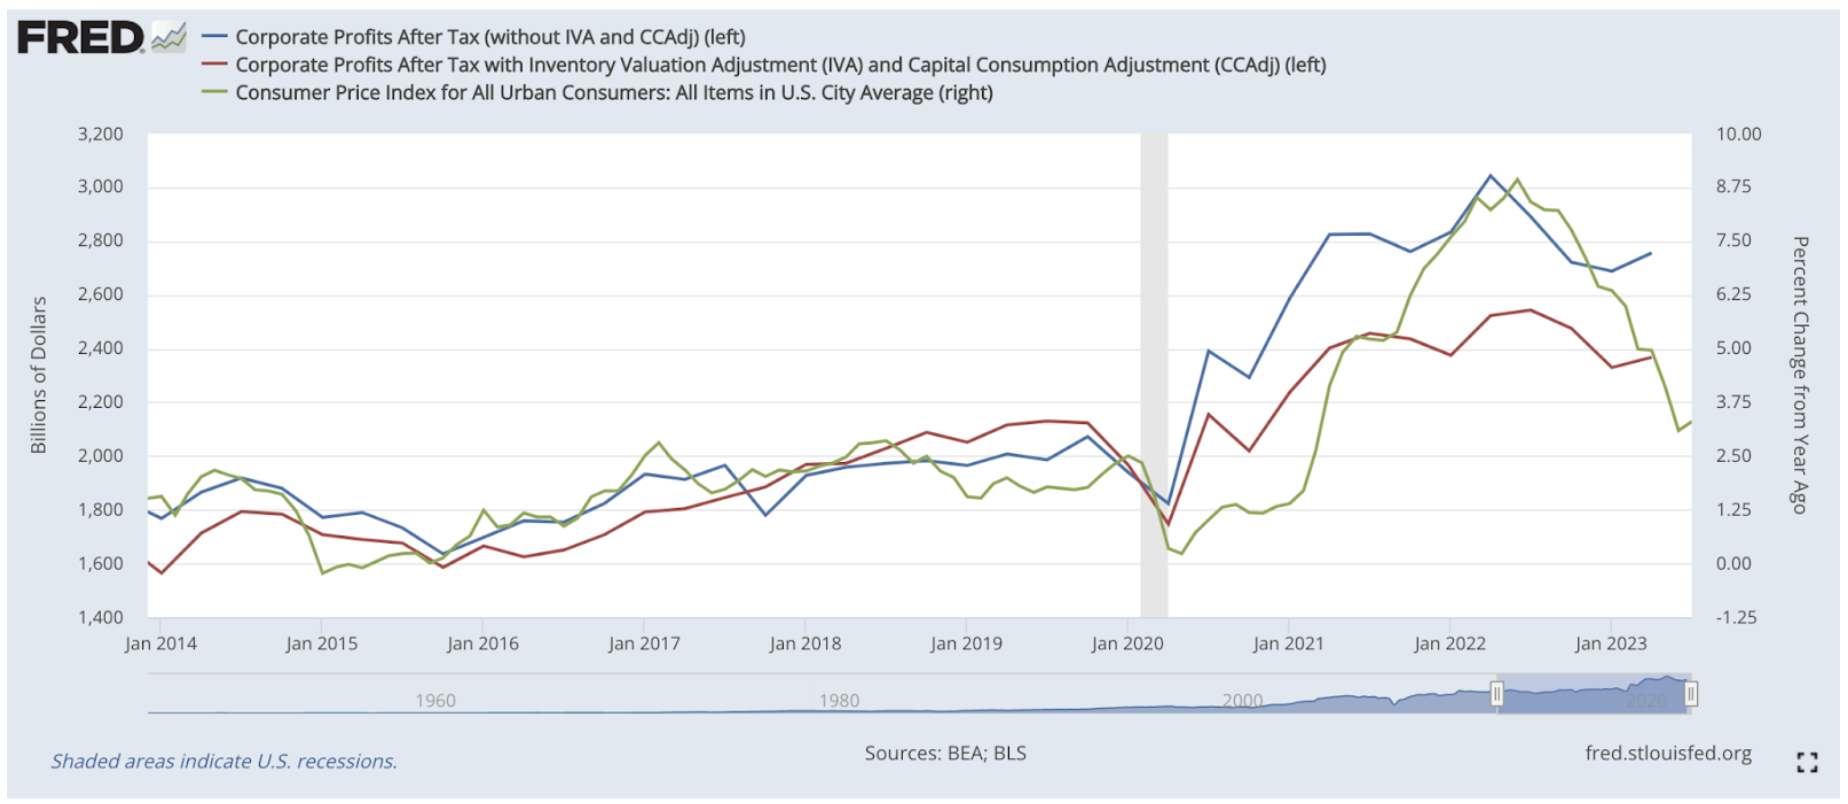
We may be headed the same way. This chart below shows the same as above, but from 2014 through July 2023. The inflation green line is coming down, and the unadjusted corporate profit line (blue) is also higher. I believe it may require some period of consolidation, with the blue and red getting closer together. This could have a negative effect on the markets as investor’s look ahead to 2024 earnings and start to adjust for this.
Now, of course, in the previous period of the 1970s/1980s, consumer and industrial companies were a much larger part of the economy and markets. Today, out of the largest 1000 stocks, just over 25% have inventories that are ⅓ or more of their current assets. So, the impact from falling inflation on corporate profits may be milder than in the early 1980’s.
But, it’s something to be aware of as you invest. Study the balance sheets and earnings expectations of the companies you own to look for the potential of this.
Or, put more simply, know what you own.
Sources: US Bureau of Labor Statistics, US Bureau of Economic Analysis, Federal Reserve Bank of St. Louis.