Technically, no: what the technicals are saying now
Technically, no: what the technicals are saying now


Can you wear dress shoes while working out? Technically, yes. Can you put mayonnaise on your pizza? Technically, yes. Can you build a portfolio by randomly picking stocks like the lottery randomly picks numbers? Technically, yes. But in all situations, most people might tell you to consider a different decision.
In making investment decisions, there are several ways to analyze markets and individual investments. After years of learning from others, I believe there is no single way to do it. Diversity in analysis is as important as diversity in the investments themselves—that includes fundamental and technical analysis. Fundamental analysis entails looking at the financials of a company and predicting how these may change over time—and whether the earnings of the company are fully considered in the price of the security. Often, this approach is described as holding an assumption that not all information is included in the value—that the analysis can uncover something not fully appreciated. As an example, after doing analysis you might conclude that the current price assumes a 5% growth rate for a company’s earnings, but that your own work shows something higher. This may lead you to conclude the stock price should be higher.
Technical analysis, on the other hand, is a form of security analysis that uses price and volume data, placing them in charts. The charts are analyzed using various indicators to draw conclusions for investment (and/or trading) decisions. Opposite to fundamental analysis, technical analysis assumes all information is already reflected in the price of the security and that price movements can take reoccurring patterns. For example, looking at the price chart for a stock may take a certain shape that can be a bearish signal, leading you to conclude the price could move lower. Since technical analysis is really about looking at a chart or two, let’s go through a current example using moving average indicators on the S&P 500 Index:
Here is a chart of the S&P 500 Index, with a line for the 50-day moving average (in red, the average price over the last 50 days, changing each day) and the 200-day moving average (in blue).
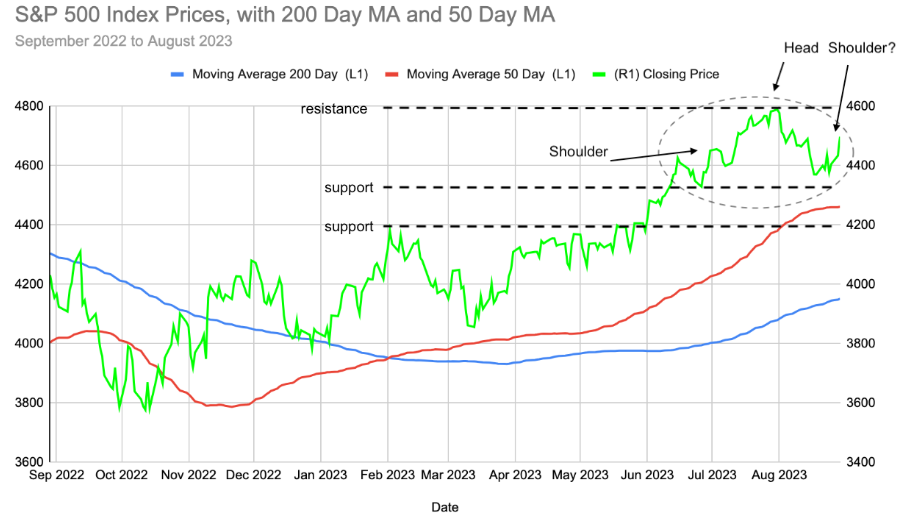
These moving averages are arguably the most commonly used by traders and investors, so looking at them can provide an idea of where buyers may attempt to enter the market and sellers may think about placing their orders.
The chart shows a couple things.
“Supports” at 4,325 and 4,200 (the latter was the resistance earlier in the year) and a “resistance” of 4,600.
There is also a potential head and shoulders pattern nearing completion. The shoulders are around a level of 4,500, the head at 4,630, and the lower support at 4,325.
Now, a head and shoulders pattern is considered a bearish signal. So, the interpretation is if this continues to play out, one could expect to see the index move lower, re-testing the support level of 4,325. If you believe the support/resistance levels are reliable, the S&P could continue to fall in price in the near term, until it reaches the support level of 4,200. Conversely, if the market rallies from here, it needs to break through the 4,600 resistance level for the uptrend to continue. However, if it doesn’t, a so-called “double top” will have formed, which is also a bearish signal.
Now, things like moving averages hold no special powers. But if enough buyers and sellers find a level interesting, they can become a self-fulfilling prophecy. However, a limitation with technical analysis is that there are so many. It’s easy to get a mixed signal, as one indicator on a candlestick chart could encourage a trader to buy, while another indicator on a line chart could tell a trader to sell. Not to mention, technical analysis is backward-looking and as new information is absorbed by the market, things can change.
That said, what the chart above is showing us wouldn’t be very out of line from my view that September could be volatile. Historically, it's been a bad month for the stock market. And sentiment about economic growth has become somewhat sanguine—leaving room for disappointment if data like job growth falls materially, economic growth slows from continued bank lending tightening, or the consumer softens from lower excess savings and the resumption of student loan payments.
Could the markets be up in September? Technically, yes. But I’ll probably personally wait and watch for now—trying not to react to the short term.
Source for chart: Bloomberg, Robinhood Financial