The why behind shifting markets
The why behind shifting markets


Real talk, sometimes you have to make sure the wave you are riding is your own. In today’s environment where social media and technology are increasingly dominating our daily lives—and sometimes disrupting them—we need to check ourselves that our beliefs are genuinely ours and not just reflections of the deluge of opinions we are exposed to.
In that vein, many investors interpreted—or rather, I believe, misinterpreted—the recent small-cap rally and market sector rotation (from tech to energy and real estate) we’ve seen this last week was exclusively driven by the shifting odds in the U.S. presidential election. While this did have some impact, in my opinion, not enough credit has been given to the improving macro data—that was practically goldilocks-like (neither too hot nor too cold, you get the idea).
The Consumer price index (CPI) was cooler, leading to increased probabilities of a Fed rate cut, while retail sales strengthened and jobs, though cooling, remained solid. These factors typically favor economically sensitive stocks that have largely underperformed for more than a year (check out my recent posts Wen Small Caps? and REITs: Too soon?).
Digging deeper, the Leading Indicator Index, which takes a composite view of the economy and consumer expectations, has been trending higher. That upward trend may be signaling a turning point, despite ongoing concerns about consumer risks. Historically, the index has moved in tandem with a market rotation into cyclically leaning areas like financials, energy, and domestic equities such as small caps (the biggest sector in small caps is financials). The following chart leads me to think this could continue:
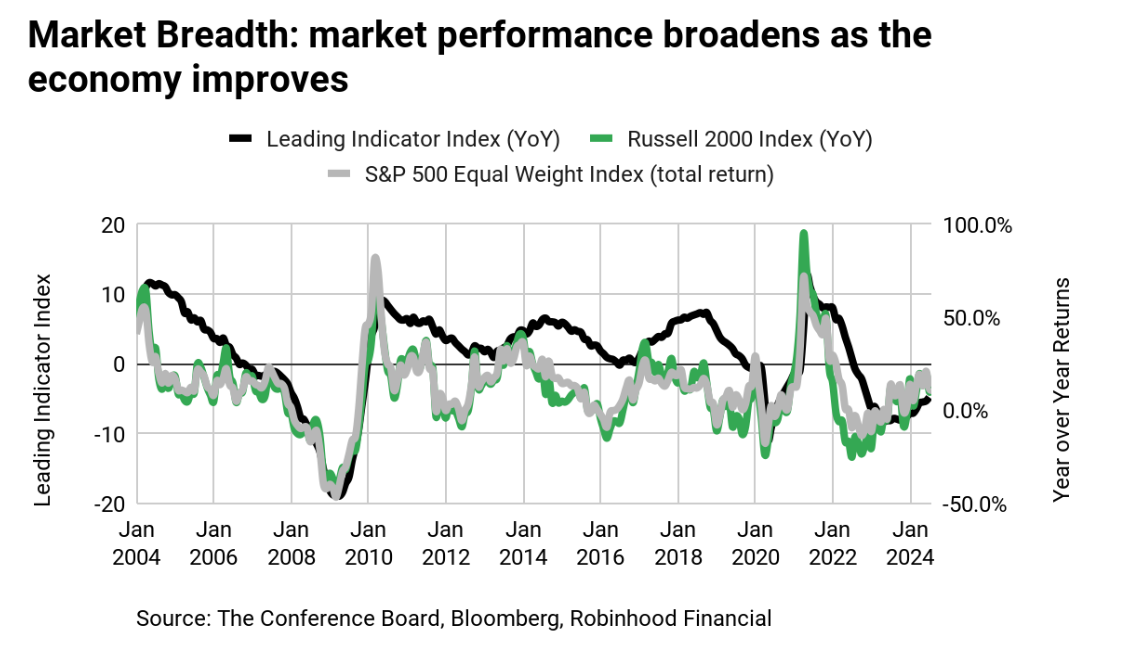
But even as small caps rallied, technology stocks experienced a dip, raising the question: what information could have driven this selloff?
First, valuations. The PEG ratio (the consensus price/earnings relative to expected growth) shows the price investors are paying for expected earnings growth. Typically a ratio less than 1 is considered attractive, while above 1 is expensive. On the surface, among the 5 largest companies, all in tech or comm services, 4 are in the middle to the lower end of their 5-year historical range, with 3 below the PEG of the broader growth index, and a few hovering near the “not expensive” line.
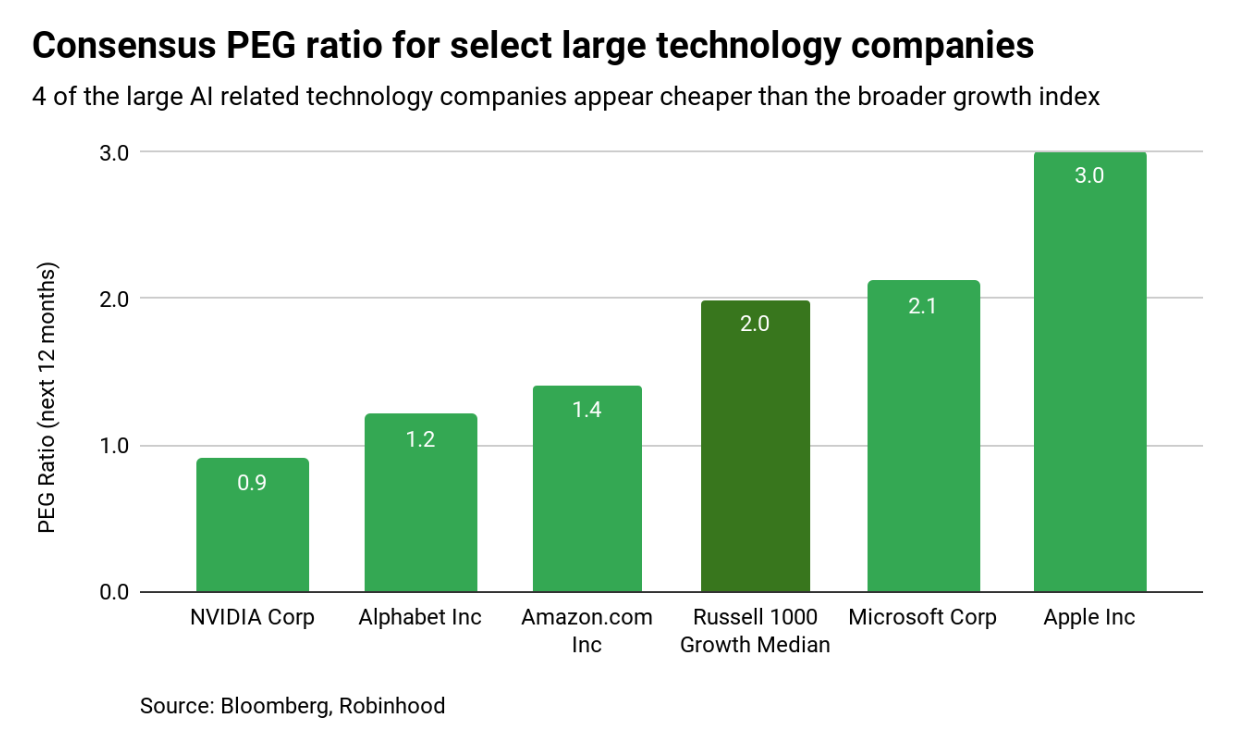
But here's the catch: this is all based on earnings growth expectations, and these expectations are high. For example, consensus expects Nvidia’s earnings to grow by 137% over the next 12 months. While anything is possible, this could be a steep bar to climb, potentially leading to disappointment in the short term. If it does end up being lower, these PEG ratios are actually higher.
Secondly, uncertainty surrounding the upcoming presidential election. Neither investors nor the public know who our next president will be or what exact policies will follow, bringing uncertainty about the future. If there's one thing markets can’t stand, it's uncertainty. Uncertainty about how the next president’s policies might impact some of the names in the sectors that have sold off, I believe, have a role.
Looking ahead, if data remains positive and the Fed proceeds with a rate cut in September, the market could continue to run, although not in a linear upward motion (a correction would be normal). As we shared in our mid-year outlook, we could see a normal correction soon. AI-tech giants start reporting earnings this week (Google yesterday, Microsoft and Meta next week), so we will get more info soon.
However, my own wave is still firmly in the belief that this next phase of market growth will likely be less dependent on a select few technology stocks. Instead, I anticipate broader participation, including economically sensitive stocks, where correlations between stocks is low. This, to me, emphasizes opportunities in 1) playing the difference in valuations and 2) individual stock selection, based on each company’s merits rather than broad themes.