What is a T-test?

A t-test is a statistic used to compare the averages of two groups (or challenge a hypothesis) to see if differences or similarities are real or just random chance.
🤔 Understanding a t-test
A lot of big — and perhaps unfamiliar — mathematical terms usually surround explanations of t-tests. Still, a t-test really is nothing more than a way to use math to test relationships between groups — or to see if observed results match a hypothesis (a guess based on observation or data). The t-test looks at a set of data called the t-statistic, a measure of how well results fit a theory or expected result. Then it tries to figure out if differences — or similarities — between two sets of data are likely to happen all the time or if they were just random chance. For comparing three or more sets of data, a different method must be used, called an analysis of variance. Student test grades, marketing target groups, possible investing results, even scientific research into animal behavior, all often might be analyzed using a t-test.
Let’s imagine that an investor notices one of her favorite stocks seems to lose value every summer. To test whether this is a real trend, she writes down a few dozen randomly collected samples of the stock price during the summer over the last couple of years and gets the average of those prices. Then she does the same with the stock prices during the winter. She can then use a t-test to compare those average prices to see if the summer prices really are significantly different than the winter prices.
Takeaway
A t-test is like an x-ray for data...
The doctor knows what a patient’s bones should look like under an x-ray — just like a researcher has an idea of why one set of data should look like another — or she has a hypothesis about why the bones might look different than normal. Maybe the patient was hit by a car while biking. A t-test — like an x-ray — will see how well a hypothesis matches the observed data.
New customers need to sign up, get approved, and link their bank account. The cash value of the stock rewards may not be withdrawn for 30 days after the reward is claimed. Stock rewards not claimed within 60 days may expire. See full terms and conditions at rbnhd.co/freestock. Securities trading is offered through Robinhood Financial LLC.
What is Student’s t-test?
Student’s t-test refers the pseudonym of the author who first described the t-test. In 1908, William Sealy Gosset — a chemist working for the Guinness brewery in Dublin — publishing under the pseudonym Student, developed the t-test and t distribution.
Student’s t-test, in statistics, describes a method of testing hypotheses about the mean of a small sample drawn from a normally distributed population when the population standard deviation is unknown.
What assumptions are made in a t-test?
Assumptions made in a t-test are often connected to the limits of a t-test. The assumptions made basically list the things needed for the t-test to be accurate.
Common assumptions are:
- Scale: Scale means that the number scale used in the calculations is continuous and numbered, such as scores on an IQ test.
- Representative and random: The heart of statistics is random sampling. Samples used in t-tests should be both representative of the whole and randomly selected.
- Bell shape: The results of plotting data from a t-test sample should look like a bell curve. That is, it should be a normal distribution. If it’s not, t-testing won’t work.
- Enough data: In addition to being representative of the group sampled, and randomly sampled, there must be enough data. A sample of 5 data points out of a group of 500,000 wouldn’t give representative results, for example.
- Grouping (variance): Plotting data in statistics usually results in a bell shape. However, sometimes, it looks more like throwing confetti. A t-test assumes that the points of data for both groups are relatively similar in how the points are arranged when plotted out. In other words, are there a lot of outliers (data far outside where most data is clustered on the chart) or not?
How are t-tests calculated?
Before we can dig into calculating a t-test, some basic terms need to be explained.
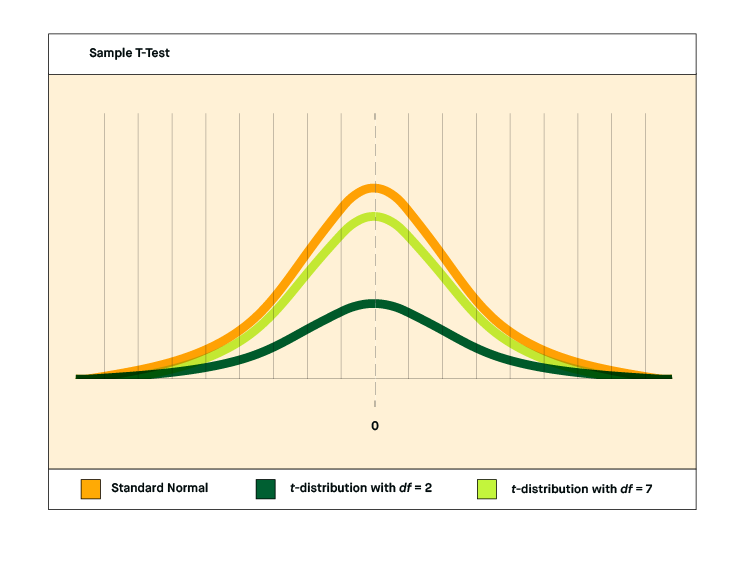
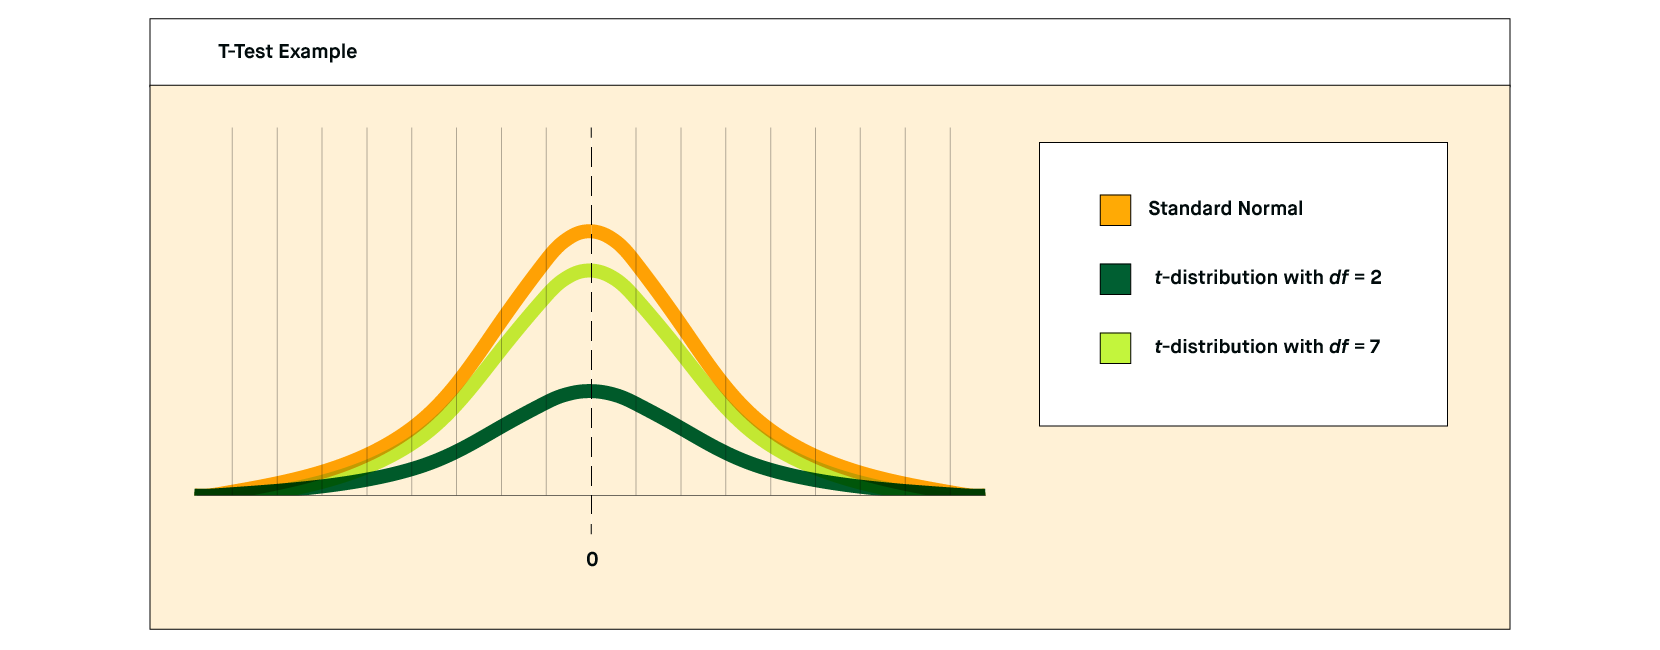
- Standard deviation represents how much variance there is between the highest and lowest data points. Visually this results in the width of the bell curve. More variance gives a broader and shorter curve, while less variance gives a taller and narrower curve.
- Mean is one method of calculating average.
- Difference refers to the distance between the data averages. The difference in means refers to how far apart the center data, the average scores are between the two sets being examined.
- Group size refers to how many data points are in the group of data used.
T-test formulas are not as simple as just filling in numbers to variables. Just getting to the equation can be daunting. A null hypothesis (no difference) and a hypothesis to be tested must first be constructed in statistical formula terms. A null hypothesis is the number result meaning there is no difference between the averages. The hypothesis to be tested is the formula way of writing what you want to find out, such as if Broker A out-performs Broker B or if urbanites eat dinner later than rural people. From there, variables must be defined. Then, the t-score (a standardized representation of the data arrangement) is calculated to be compared with a t-table (a description of how the data is scattered on the bell shape).
The comparison of the t-score and t-table gives you an answer on the probability of results being random or not.
Never fear, many online calculators and free to download templates for Excel are available. If working from scratch, rather than analyzing data found elsewhere, you may need to lookup variable symbol meanings for part of the data entry.
How does the t-test relate to equal variance and unequal variance?
Equal variance and unequal variance are just two conditions under which t-tests operate. Both are a subset of an independent t-test. Equal variance (pooled) allows you to compare results from groups with the same number of data points or if there are no significant differences in how wide the bell curves are. If it meets either condition, the equal (pooled variance) version is used. If the two bell curves have significantly different variances (say, one is much wider than the other), then the unequal variance version is used.
How do I figure out which t-test method to use?
The primary factors in deciding on which t-test method to use are data available and what you are trying to test. Independent, paired sample, and one sample all compare results, but they compare results for different scenarios.
- Independent: Independent t-tests compare the averages from two different sets (groups). This is the basic t-test.
- Paired sample: Paired sample t-tests, sometimes called a dependent sample t-test, looks at the same group multiple times or compares a control vs. test group. Think of paired sample t-tests as a fluke check. Was it a fluke that something happened one time or not? A drug company might have a control group (given a placebo) and a test group in a drug study. Comparing the placebo group to the test group with a t-test could show if the drug actually works or if it just seemed to work.
- One sample: In some cases, previous studies have already determined a mean (average) for a specific situation (like average math scores of seniors in high school for California). In those cases, a one-sample test compares the average of a new group against that already known group average.
How do I interpret the results of a t-test?
T-test results can be purely numerical, but they are sometimes shown with the bell curve partially shaded plus some numerical results. The two ends (or one end) of the bell curve, where it meets the ground, are the areas outside realms of likely similarities, and there is an area to either side of the average (middle line) where results are expected to fall.
Unless you are fluent in statistics, you’ll likely be reading t-tests on potential investments rather than creating and running t-tests yourself. That means understanding the results is the most crucial bit for you. When interpreting a t-test (regardless of the type), the two main factors to remember are t-value and degrees of freedom.
The t-value shows the differences between the averages and the groups themselves in ratio form. The top number (numerator) shows the difference in the averages, and the bottom number (denominator) represents differences in the sample sets themselves. The larger the t-score (when divided out to a whole or decimal number), the more difference between the sets of information and the smaller the t-score, the less difference between the sets of data.
Degrees of freedom relates to the size of the data sample set and the possibility of variances.
Once you have both of these numbers isolated, you then look on a table called a t-table. This table lists degrees of freedom on the left and t-scores across the top. To see where the combination of t-value and degrees of freedom land, you’ll follow the degree of freedom row over to the matching t-score column. The number in that cell can then be compared to a legend with the t-table.
The legend will tell you if that number is too high (or too low) to be considered significant. The study should include a t-table reference with the legend for you to compare the results.
New customers need to sign up, get approved, and link their bank account. The cash value of the stock rewards may not be withdrawn for 30 days after the reward is claimed. Stock rewards not claimed within 60 days may expire. See full terms and conditions at rbnhd.co/freestock. Securities trading is offered through Robinhood Financial LLC.

